Definition
A statistical hypothesis is a conjecture about a population parameter. This conjecture may or may not be true.
Definition
A hypothesis test uses sample data to choose between two competing hypotheses about a population characteristic.
As in a judicial proceeding, in a hypothesis test you initially assume that a particular hypothesis, called the null hypothesis, is the correct one. You then consider the evidence (sample data) and reject the null hypothesis in favor of a competing hypothesis, called the alternate hypothesis.
Definition
A null hypothesis, denoted by $H_0$, is a claim (or statement) about a population parameter that is assumed to be true until it is declared false.
An alternative hypothesis, denoted by $H_a$ or $H_1$, is a claim about a population parameter that will be true if the null hypothesis is false.
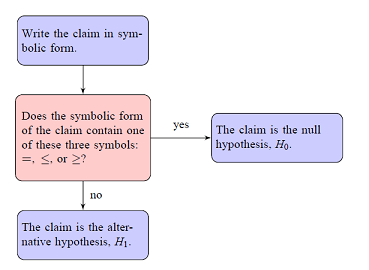
To write the null and alternative hypotheses, translate the claim made about the population parameter from a verbal statement to a mathematical statement. Then, write its complement. For instance if the claim value is $k$, and the population parameter is $\mu$, then some possible pairs of null and alternative hypotheses are \[ \begin{gather*} \left\{\begin{array}{lll} H_0: & \mu \leq k \\ H_a: & \mu > k \end{array}\right. \qquad\qquad \left\{\begin{array}{lll} H_0: & \mu \geq k \\ H_a: & \mu < k \end{array}\right. \qquad\qquad \left\{\begin{array}{lll} H_0: & \mu = k \\ H_a: & \mu \neq k \end{array}\right. \end{gather*} \]
Regardless of which of the three pairs of hypotheses you use, you always assume $\mu=k$ and examine the sampling distribution on the basis of this assumption. Within this sampling distribution, you will determine whether or not a sample statistic is unusual.
| In carrying out a test of $H_0$ versus $H_a$, the null hypothesis $H_0$ is rejected in favor of the alternative hypothesis $H_a$ only if the sample data provide convincing evidence that $H_0$ is false. If the sample do not provide such evidence, $H_0$ is not rejected.
The two possible conclusions in a hypothesis test are reject $H_0$ and fail to reject $H_0$ |
|---|
If you are not convinced that the null hypothesis is false, you fail to reject the null hypothesis. It is important to note that this does not mean that you have strong or convincing evidence that the null hypothesis is true. You can only say that you were not convinced that the null hypothesis is false.
| Hypothesis Test Conclusion | This means that... |
|---|---|
| Reject $H_0$ | There is convincing evidence against the null hypothesis. If $H_0$ were true, the sample data would be very surprising. |
| Fail to Reject $H_0$ | There is not convincing evidence against the null hypothesis. If $H_0$ were true, the sample data would not be considered surprising. |
A statistical hypothesis test can only demonstrate strong support for the alternative hypothesis. If the goal of the study is to decide whether sample data support a particular claim about a population, this claim will determine the alternative hypothesis. In a hypothesis testing situation, you usually begin by translating the claim of interest into the alternative hypothesis. However, for these textbook homework problems we do in this class, the claim can be either the null hypothesis or the alternative hypothesis.
The 5 Steps of a Statistical Hypothesis Test
- State the null hypothesis, $H_0$
- State the alternative hypothesis, $H_a$
- Determine values for the test statistic and the standardized test statistic.
- Find the $P$-value. Use the $P$-value to decide whether or not to reject the null hypothesis.
- Write the full sentence conclusion (result) of the hypothesis test.
Calculator Facts
- (Section 7.2) If your hypothesis test is about a population mean $\mu$, and the value of population standard deviation $\sigma$ is known or given, then use your calculator's "z-test" to obtain the p-value
- (Section 7.3) If your hypothesis test is about a population mean $\mu$, and the value of population standard deviation $\sigma$ is unknown or not given, then use your calculator's "t-test" to obtain the p-value
- (Section 7.4) If your hypothesis test is about a population proportion (percentage) $p$, then use your calculator's "1-prop-z-test" to obtain the p-value
The 5 Steps of a Statistical Hypothesis Test
- State the null hypothesis, $H_0$
- State the alternative hypothesis, $H_a$
- Determine values for the test statistic and the standardized test statistic.
What is a test statistic?
Definition
The test statistic is the sample mean, sample proportion or sample variance or standard deviation (depending on which one of the parameters, $\mu, p, \sigma^2,$ or $\sigma$, you are testing).What is a standardized test statistic?
The Empirical Rule tells us that 95% of our test statistics (and standardized test statistics) will be within 1.96 standard deviations of the mean. 5% of test statistics are either less than -1.96 or greater than 1.96.Definition
The standardized test statistic is the number of standard deviations that your sample statistic is above or below the hypothesized mean (of the sampling distribution).Formulas used for the Standardized Test Statistic
- If the test is about a population mean, $\mu$, with the value of $\sigma$ given or known, the standardized test statistic is given by the formula $z=\dfrac{\bar{x}-\mu_0}{\sigma/\sqrt{n}}$, where $\mu_0$ is the value of the mean selected for the null hypothesis.
- If the test is about a population mean, $\mu$, with the value of $\sigma$ not given or unknown, the standardized test statistic is given by the formula $t=\dfrac{\bar{x}-\mu_0}{s/\sqrt{n}}$
- If the test is about a population proportion, $p$, the standardized test statistic is given by the formula $z=\dfrac{\hat{p}-p_0}{\sqrt{\dfrac{p_0q_0}{n}}}$, where $p_0$ is the value of the population proportion selected for the null hypothesis and $q_0=1-p_0$.
- Find the $P$-value. Use the $P$-value to decide whether or not to reject the null hypothesis.
If the p-val $\leq \alpha$ then reject the null hypothesis.
If the p-val > $\alpha$ then do not reject the null hypothesis.
- Write the full sentence conclusion (result) of the hypothesis test.
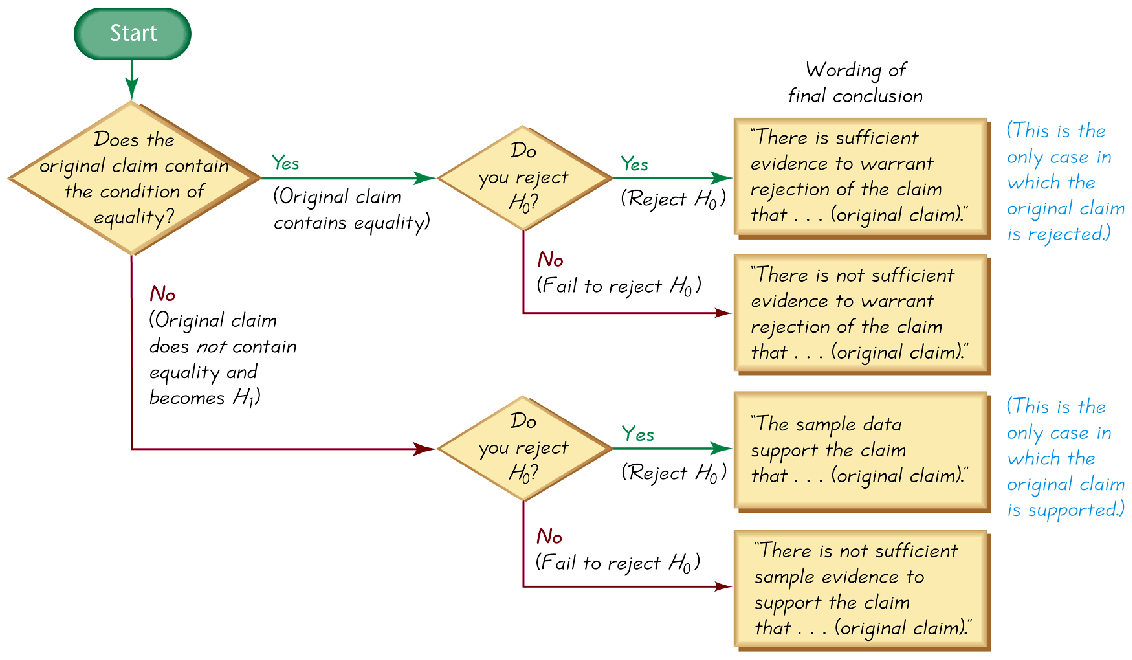
Use the wording from the flow chart given below
| Two-Tailed Test | Left-Tailed Test | Right-Tailed Test | |
| Sign in the null hypothesis, $H_0$ | $=$ | $\geq$ | $\leq$ |
| Sign in the alternative hypothesis, $H_a$ | $\neq$ | < | > |
Note that the null hypothesis always has an equal to (=) or a greater than or equal to ($\geq$) or a less than or equal to ($\leq$) sign, and the alternative hypothesis always has a not equal to ($\neq$) or a less than (<) or a greater than (>) sign.
What is a $p$-value?
Definition
How can I find the $p$-value?
Run the appropriate test (z-test, t-test or 1-prop-z-test) on your calculator and it gives you the $P$-value. Draw a picture of the appropriate sampling distribution. Center the distribution at the value used in the statement of your null hypothesis. Afterwards, label the location of the sample mean or sample proportion along the x axis. Finally, sketch the graph of the standardized sampling distribution (either the $z$ or $t$ distribution), and label the location of the test statistic. Draw a vertical line at that location. Then, use the flowchart below to help you sketch the correct area under the sampling distribution that represents the p-value.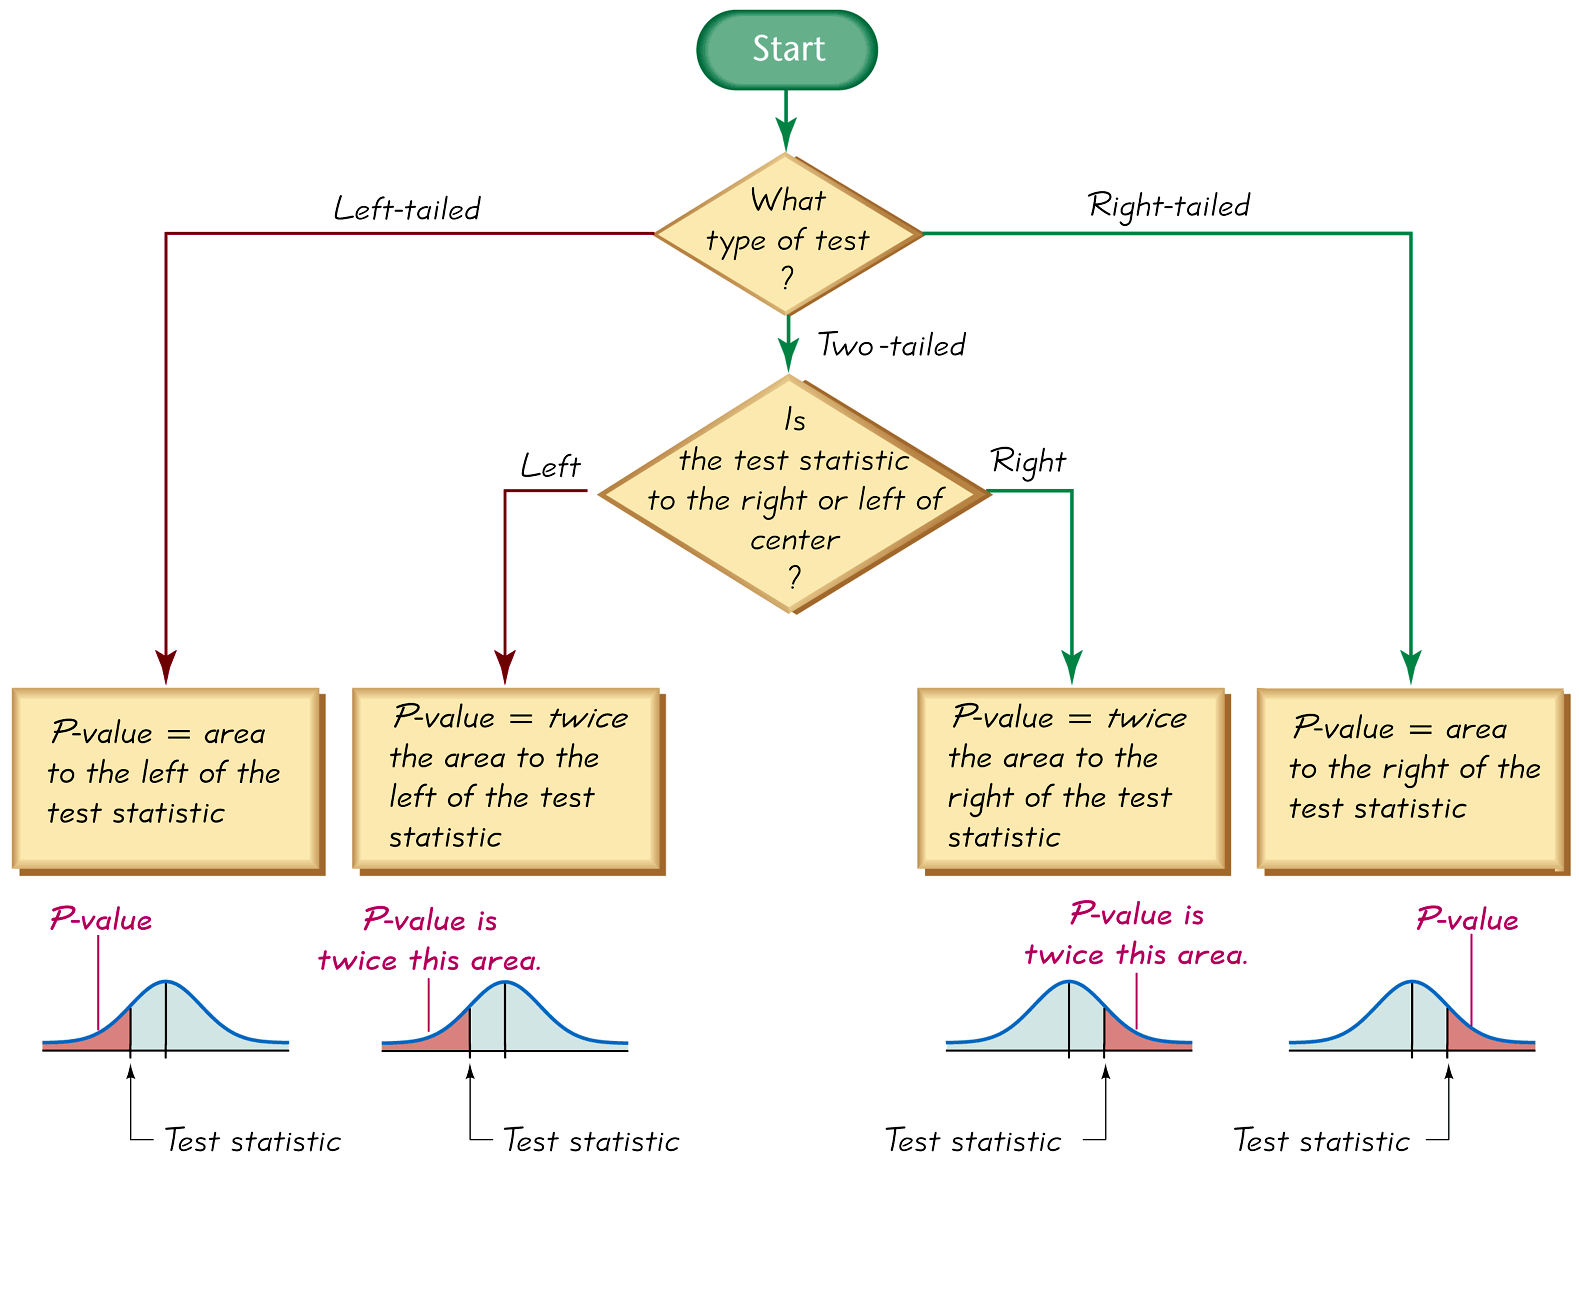
How do I use the $P$-value to decide whether or not to reject the null hypothesis?
What is $\alpha$ (alpha)?
Definition
Definition
| Hypothesis Test Conclusion | This means that... |
|---|---|
| Reject $H_0$ | There is convincing evidence against the null hypothesis. If $H_0$ were true, the sample data would be very surprising. |
| Fail to Reject $H_0$ | There is not convincing evidence against the null hypothesis. If $H_0$ were true, the sample data would not be considered surprising. |
Example 1 (A right-tailed test for $\mu$ — with $\sigma$ known — DATA)
The maximum acceptable level of a certain toxic chemical in vegetables has been set at 0.4 parts per million (ppm). A consumer health group measured the level of the chemical in a random sample of tomatoes obtained from one producer. The levels, in ppm, are shown below. \[ \begin{array}{ cccc } 0.31 & 0.47& 0.19& 0.72& 0.56\\ 0.91& 0.29& 0.83 &0.49& 0.28\\ 0.31& 0.46& 0.25& 0.34& 0.17 \\ 0.58& 0.19& 0.26& 0.47& 0.81 \end{array} \] Do the data provide sufficient evidence to support the claim that the mean level of the chemical in tomatoes from this farmer is greater than the recommended level of 0.4 ppm? Use a 0.05 significance level to test the claim that these sample levels come from a population with a mean greater than 0.4 ppm. Assume that the standard deviation of levels of the chemical in all such tomatoes is 0.21 ppm.
Questions/Instructions
- What is the symbolic form of the claim?
- What are the the null and alternative hypotheses?
- What formula should be used for the test statistic?
- What is the value of the test statistic and the standardized test statistic?
- Determine what the p-value is and use it to draw a conclusion about the test.
- State a full sentence conclusion using the statistical language learned in the class
Answers
- What is the symbolic form of the claim?
The claim is that the population mean is more than 0.4 ppm, or $$ \mu >0.4 $$
- What are the the null and alternative hypotheses?
Since the claim DOES NOT contain the condition of equality $(=, \ \leq \ \geq)$, the claim is the alternate hypothesis. (Recall that the claim can either be the null or alternative hypothesis, but the condition of equality always belongs to the null hypothesis.) \[ \eqalign{ H_0: \quad \mu\leq0.4\cr H_a: \quad \mu > 0.4 & \quad\text{(claim)} } \]
- What formula should be used for the standardized test statistic?
The test is about a population mean with $\sigma$ known to be 0.21 ppm, so the standardized test statistic is \[ z=\dfrac{\bar{x}-\mu_0}{\sigma/\sqrt{n}} \]
- What is the value of the test statistic and standardized test statistic?
We can do a z-test on the calculator (since the value of $\sigma$ was given) and get values for the test statistic, the standardized test statistic and the p-value.Hypothesis Test for the Mean using a $z$-Test (DATA)
- Enter the data values into L1 (list one).
- Press STAT and move the cursor to TESTS.
- Press 1 for ZTest.
- Move the cursor to Data and press ENTER.
- Type in the appropriate values for $\mu_0$ (the hypothesized value from the null hypothesis) and the population standard deviation, $\sigma$.
- Move the cursor to the appropriate alternative hypothesis and press ENTER.
- Move the cursor to Calculate and press ENTER.
In this case, when carrying out step 6, we set the calculator to do a right-tailed test since our alternative hypothesis has the > symbol. Here are pictures of the input and output screens from running the z-test.
INPUT
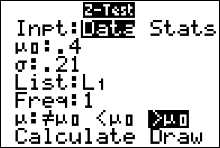
OUTPUT
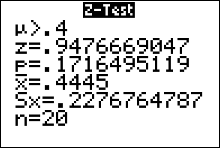
The output screen gives us
The Alternative Hypothesis, $H_a$ $\mu > 0.4$ The Standardized Test Statistic $z=0.95$ (round to two decimal places) The $p$-value 0.1716 (round to four decimal places) The Test Statistic (the sample mean) $\bar{x}=0.44$ The Sample Standard Deviation $s=0.23$ The sample size $n=20$
- Determine what the p-value is and use it to draw a conclusion about the test.
The p-value is about $0.1716$. Recall that the significance level was given in the statement of the problem as $\alpha=0.05$. Then, \[ \color{red}{\text{since the $p$-value} > \alpha, \text{ we do not reject }H_0} \] The sign used in $H_a$ is a greater than, so we have a right-tailed test and the flow chart indicates the p-value is the area right of $\bar{x}=0.445 $ ppm. For any right-tailed test for the mean, the p-value is always the probability of obtaining a sample mean greater than or equal to the one we obtained from the sample. That is, the p-value $= P(\bar{x}\geq0.445) = P(z\geq0.9477)\approx0.1716$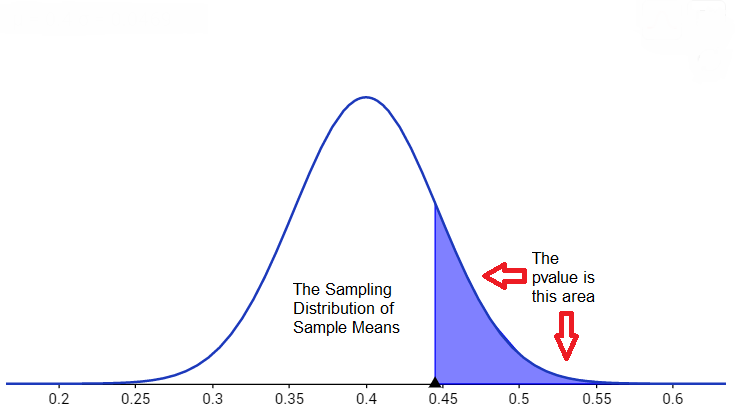
If we rerun the z-test but in step 7 we move the cursor to Draw and press ENTER, we get the picture of the sampling distribution converted to the $z$ distribution.
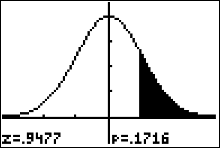
The shaded area represents the p value.
- State a full sentence conclusion using the statistical language learned in the class
We can use the flow chart to help us with the correct wording of the conclusion. There is not sufficient sample evidence to support the claim that the average level of the chemical in tomatoes from the farmer is greater than the recommended level of 0.4 ppm
Example 2 (A two-tailed test for $\mu$ — with $\sigma$ known — STATS)
A random sample of 100 pumpkins is obtained and the mean circumference is found to be 40.5 cm. Assuming that the population standard deviation is known to be 1.6 cm, use a 0.05 significance level to test the claim that the mean circumference of all pumpkins is equal to 39.9 cm.
Questions/Instructions
- What is the symbolic form of the claim?
- What are the the null and alternative hypotheses?
- What formula should be used for the standardized test statistic?
- What are the values of the test statistic and standardized test statistic?
- Determine what the p-value is and use it to draw a conclusion about the test.
- State a full sentence conclusion using the statistical language learned in the class
Answers
- What is the symbolic form of the claim?
The claim is that the population mean is equal to 39.9 cm, or $$ \mu =39.9 $$
- What are the the null and alternative hypotheses?
Since the claim has the condition of equality $(=, \ \leq \ \geq)$, the claim is the null hypothesis. (Recall that the claim can either be the null or alternative hypothesis, but the condition of equality always belongs to the null hypothesis.) \[ \eqalign{ H_0: \quad \mu=39.9\cr H_a: \quad \mu\neq39.9 & \quad\text{(claim)} } \]
- What formula should be used for the standardized test statistic?
The test is about a population mean with $\sigma$ known to be 1.6 cm, so the test statistic is \[ z=\dfrac{\bar{x}-\mu_0}{\sigma/\sqrt{n}} \]
- What are the values of the test statistic and standardized test statistic?
We can do a z-test on the calculator (since the value of $\sigma$ was given) and get values for the test statistic, the standardized test statistic and the p-value.Hypothesis Test for the Mean using a $z$-Test (STATS)
- Press STAT and move the cursor to TESTS.
- Press 1 for ZTest.
- Move the cursor to Stats and press ENTER.
- Type in the given values for the sample mean and population standard deviation.
- Move the cursor to the appropriate alternative hypothesis and press ENTER.
- Move the cursor to Calculate and press ENTER.
In this case, when carrying out step 5, we set the calculator to do a two-tailed test since our alternative hypothesis has the $\neq$ symbol. Here are pictures of the input and output screens from running the z-test.
INPUT
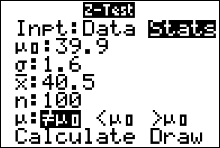
OUTPUT
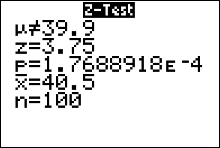
The output screen gives us
The Alternative Hypothesis, $H_a$ $\mu \neq 39.9$ The Standardized Test Statistic $z=-3.75$ The $p$-value $1.76 \times 10^{-4}\doteq 0.000176\approx0.0002$ The Test Statistic -- The Sample Mean $\bar{x}=40.5$ The sample size $n=100$
- Determine what the p-value is and use it to draw a conclusion about the test.
The p-value is about $0.0002$. Recall that the significance level was given in the statement of the problem as $\alpha=0.05$. Then, \[ \color{red}{\text{since the $p$-value} < \alpha, \text{ we reject }H_0} \] The sign used in $H_a$ is a not equals, so we have a two-tailed test and the flow chart indicates the p-value is the twice the area right of $\bar{x}=40.5 $ cm. For any two-tailed test for the mean, when the sample statistic is above the value stated in the null, the p-value is always twice the probability of obtaining a sample mean greater than or equal to the one we obtained from the sample. That is, the p-value $= 2\cdot P(\bar{x}\geq40.5) = 2\cdot P(z\geq3.75)\approx0.0002$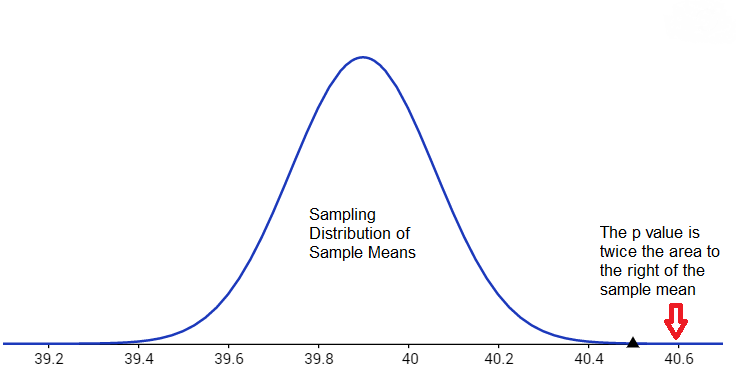
If we rerun the z-test but in step 6 we move the cursor to Draw and press ENTER, we get the picture of the sampling distribution converted to the $z$ distribution.
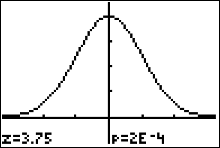
The shaded area represents the p value.
- State a full sentence conclusion using the statistical language learned in the class
We can use the flow chart to help us with the correct wording of the conclusion. There is sufficient sample evidence to warrant rejection of the claim that the mean circumference of all pumpkins is equal to 39.9 cm.
Example (A left-tailed test for $\mu$ — with $\sigma$ known — STATS)
A local brewery distributes beer in bottles labeled 32 ounces. A government agency thinks that the brewery is cheating its customers. The agency selects 50 of these bottles, measures their contents, and obtains a sample mean of 31.7 ounces with a population standard deviation of 0.70 ounce. Use a 0.01 significance level to test the agencyʹs claim that the brewery is cheating its customers.
Questions/Instructions
- What is the symbolic form of the claim?
- What are the the null and alternative hypotheses?
- What formula should be used for the standardized test statistic?
- What are the values of the test statistic and standardized test statistic?
- Determine what the p-value is and use it to draw a conclusion about the test.
- State a full sentence conclusion using the statistical language learned in the class
Answers
- What is the symbolic form of the claim?
The claim is that the population mean is less than 32 oz., or $$ \mu < 32 $$
- What are the the null and alternative hypotheses?
Since the claim contain the condition of equality $(=, \ \leq \ \geq)$, the claim is the null hypothesis. (Recall that the claim can either be the null or alternative hypothesis, but the condition of equality always belongs to the null hypothesis.) \[ \eqalign{ H_0: \quad \mu \geq 32\cr H_a: \quad \mu < 32 & \quad\text{(claim)} } \]
- What formula should be used for the standardized test statistic?
The test is about a population mean with $\sigma$ known to be 0.70 oz., so the standardized test statistic formula is \[ z=\dfrac{\bar{x}-\mu_0}{\sigma/\sqrt{n}} \]
- What are the values of the test statistic and standardized test statistic?
The test statistic is the sample mean, 31.7 ounces, as given in the statement of the problem. We can do a z-test on the calculator (since the value of $\sigma$ was given) and get values for both the standardized test statistic and the p-value.Hypothesis Test for the Mean using a $z$-Test (STATS)
- Press STAT and move the cursor to TESTS.
- Press 1 for ZTest.
- Move the cursor to Stats and press ENTER.
- Type in the given values for the sample mean and population standard deviation.
- Move the cursor to the appropriate alternative hypothesis and press ENTER.
- Move the cursor to Calculate and press ENTER.
In this case, when carrying out step 5, we set the calculator to do a left-tailed test since our alternative hypothesis has the < symbol. Here are pictures of the input and output screens from running the z-test.
INPUT
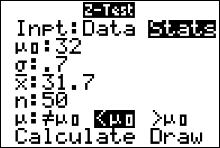
OUTPUT
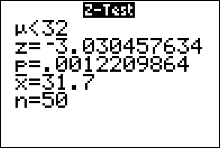
The output screen gives us
The Alternative Hypothesis, $H_a$ $\mu < 32$ The Standardized Test Statistic $z=-3.03$ The $p$-value $0.0012$ The Test Stat -- The Sample Mean $\bar{x}=31.7$ The sample size $n=50$
- Determine what the p-value is and use it to draw a conclusion about the test.
The p-value is about $0.0012$. Recall that the significance level was given in the statement of the problem as $\alpha=0.01$. Then, \[ \color{red}{\text{since the $p$-value} < \alpha, \text{ we reject }H_0} \] The sign used in $H_a$ is a <, so we have a left-tailed test and the flow chart indicates the p-value is the the area left of $\bar{x}=31.7 $ oz. For any left-tailed test for the mean, the p-value is always the probability of obtaining a sample mean less than or equal to the one we obtained from the sample. That is, the p-value $= P(\bar{x}\leq31.7) = P(z\leq-3.03)\approx0.0012$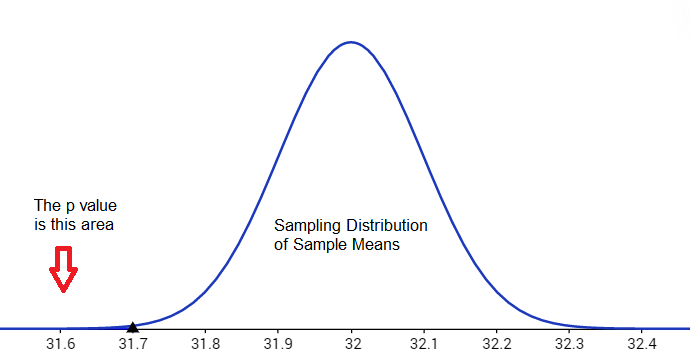
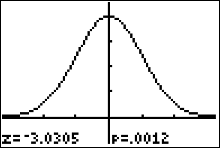
If we rerun the z-test but in step 6 we move the cursor to Draw and press ENTER, we get the picture of the sampling distribution converted to the $z$ distribution.
- State a full sentence conclusion using the statistical language learned in the class
(We can use the flow chart to help us with the correct wording of the conclusion.) The sample evidence support the claim that the brewery is cheating its customers.
Example (A right-tailed test for $\mu$ — with $\sigma$ known)
A May 8, 2008, report on National Public Radio (www.npr.org) noted that the average age of first time mothers in the United States is more than 25 years. Suppose that a recently taken random sample of 57 first-time mothers from Missouri produced an average age of 23.90 years and that the population standard deviation is known to be 4.80 years. Use the p value method to test NPR's claim based on the given sample data.
Questions/Instructions
- What is the symbolic form of the claim?
- What are the the null and alternative hypotheses?
- What formula should be used for the standardized test statistic?
- What are the values of the test statistic and standardized test statistic?
- Determine what the p-value is and use it to draw a conclusion about the test.
- State a full sentence conclusion using the statistical language learned in the class
Answers
The level of significance was not given in the statement of the problem above. Whenever this is the case, we use a 5% level of significance (that is, take $\alpha$ to be 0.05).- What is the symbolic form of the claim?
The claim is that the population mean is more than 25, or $$ \mu > 25 $$
- What are the the null and alternative hypotheses?
Since the claim DOES NOT contain the condition of equality $(=, \ \leq \ \geq)$, the claim is the alternate hypothesis. (Recall that the claim can either be the null or alternative hypothesis, but the condition of equality always belongs to the null hypothesis.) \[ \eqalign{ H_0: \quad \mu\leq25\cr H_a: \quad \mu > 25 & \quad\text{(claim)} } \]
- What formula should be used for the standardized test statistic?
The test is about a population mean with $\sigma$ known to be 4.8 years, so the standardized test statistic is \[ z=\dfrac{\bar{x}-\mu_0}{\sigma/\sqrt{n}} \]
- What are the values of the test statistic and standardized test statistic?
The test statistic is the sample mean of 23.9 years of age. We can do a z-test on the calculator (since the value of $\sigma$ was given) and get values for both the standardized test statistic and the p value. We enter in the values of $\mu_0, \ \ \bar{x}$ and $n$ as given in the statement of the problem, set the calculator to do a right-tailed test (select >$ \mu_0$) then press "calculate." Remember, $\mu_0$ is the hypothesized value of $\mu$ as stated in the null hypothesis. In addition, we know that we have a right-tailed test because the sign used in $H_a$ is a >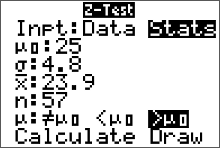 We get this output on our screen
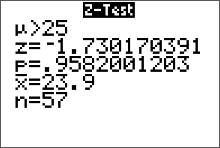 The standardized test statistic is the $z=-1.73$ (round it to two decimal places is the convention). The p-value is 0.9582 (round to four decimal places since p value is a probability).
- Determine what the p-value is and use it to draw a conclusion about the test.
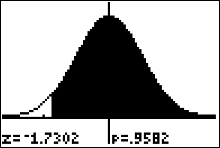
The p value is about $0.9582$. Recall that the significance level wasn't given in the statement of the problem so we use $\alpha=0.05$. \[ \color{red}{\text{Since the $p$-value} > \alpha, \text{ we do not reject }H_0} \] Note: the p-value $= P(\bar{x}>23.9) = P(z>-1.73)=0.9582$ The p-value is the probability of getting a sample mean at least as extreme as the one we obtained, or $P(\bar{x}>23.9)$, assuming the sampling distribution really is centered at $\mu=25$. The sign used in $H_a$ is a greater than, so we have a right-tailed test and the flow chart indicates the p value is the area right of $\bar{x}=23.9$.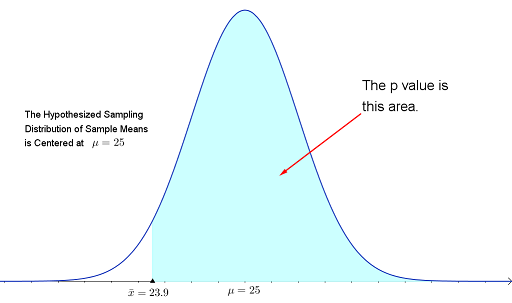 Alternatively, running a z-test and pressing "draw" will have the calculator produce the picture of the sampling distribution converted to the z-distribution.
- State a full sentence conclusion using the statistical language learned in the class
We can use the flow chart to help us with the correct wording of the conclusion. There is not sufficient sample evidence to support the claim that the average age of first time mothers in the United States is more than 25 years.
Example (A right-tailed test for $\mu$ — with $\sigma$ unknown)
A statistics website claims that the average amount spent by a dating site customer per year more than \$239. A database manager for Match.com wants you to test that hypothesis with $\alpha=0.05$. She obtains a random sample of Match.com customers and measures the amount each customer spent on the dating site last year. Assume the distribution of amounts is normally distributed. The survey results are summarized below. Are the results significant? \[ \$123 \ \ \ \ \$456 \ \ \ \ \$65 \ \ \ \ \$259 \ \ \ \ \$333 \ \ \ \ \$549 \ \ \ \ \$145\ \ \ \ \$139 \] Use the p value method to test the statistics website's claim based on the given sample data.
Questions/Instructions
- What is the symbolic form of the claim?
- What are the the null and alternative hypotheses?
- What formula should be used for the standardized test statistic?
- What are the values of the test statistic and standardized test statistic?
- Determine what the p-value is and use it to draw a conclusion about the test.
- State a full sentence conclusion using the statistical language learned in the class
Answers
- What is the symbolic form of the claim?
The claim is that the population mean is more than $\$239$, or $$ \mu > 239$$
- What are the the null and alternative hypotheses?
Since the claim DOES NOT contain the condition of equality $(=, \ \leq \ \geq)$, the claim is the alternate hypothesis. (Recall that the claim can either be the null or alternative hypothesis, but the condition of equality always belongs to the null hypothesis.) \[ \eqalign{ H_0: \quad \mu = 239& \quad\text{you may use }\mu\leq239\cr H_a: \quad \mu > 239 & \quad\text{(claim)} } \]
- What formula should be used for the standardized test statistic?
The test is about a population mean with $\sigma$ unknown, so the standardized test statistic is \[ t=\dfrac{\bar{x}-\mu_0}{s/\sqrt{n}} \]
- What are the values of the test statistic and standardized test statistic?
We can do a t-test on the calculator (since the value of $\sigma$ was NOT given) and get values for the test statistic, the standardized test statistic and the p value. We were NOT explicitly given values for $\bar{x}$ and $s$ as given in the statement of the problem, so we put the sample data in our calculator's list 1, and set the input setting of the t-Test to "data." Select >$ \mu_0$ since we have a right-tailed test, then press "calculate." Remember, we know that we have a right-tailed test because the sign used in $H_a$ is a >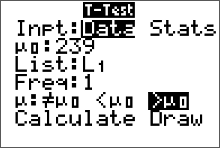 We get this output on our screen
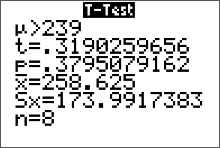 The standardized test statistic is $t=0.32$ (round it to two decimal places is the convention). The p-value is 0.3795 (round to four decimal places since p value is a probability). The sample mean was $258.63.
- Determine what the p-value is and use it to draw a conclusion about the test.
The p value is about $0.3795$. Recall that the significance level was given in the statement of the problem as $\alpha=0.05$. Since the \[ \color{red}{ p\text{-value} > \alpha, \text{ we do not reject }H_0} \] Note: the p-value $= P(\bar{x}>258.63) = P(t>0.32)\approx0.3795$ The p-value is the probability of getting a sample mean at least as extreme as the one we obtained, or $P(\bar{x}>258.63)$, assuming the sampling distribution really is centered at $\mu=239$. The sign used in $H_a$ is a greater than, so we have a right-tailed test and the flow chart indicates the p value is the area right of $\bar{x}=23.9$.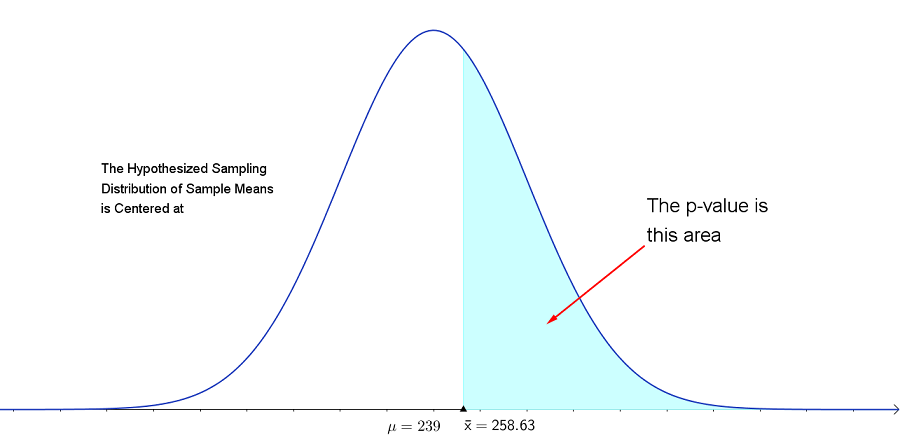
- State a full sentence conclusion using the statistical language learned in the class
(We can use the flow chart to help us with the correct wording of the conclusion.) There is not sufficient sample evidence to support the claim that the average amount spent by a dating site customer per year more than \$239.
Example (A left-tailed test for $p$)
A mail-order company claims that at least 60% of all orders are mailed within 48 hours. From time
to time the quality control department at the company checks if this promise is fulfilled. Recently the quality
control department at this company took a sample of 400 orders and found that 208 of them were
mailed within 48 hours of the placement of the orders.
Use the p value method to test company's claim at the 1% level of significance based on the given sample data.
Questions/Instructions
- What is the symbolic form of the claim?
- What are the the null and alternative hypotheses?
- What formula should be used for the standardized test statistic?
- What are the values of the test statistic and standardized test statistic?
- Determine what the p-value is and use it to draw a conclusion about the test.
- State a full sentence conclusion using the statistical language learned in the class
Answers
- What is the symbolic form of the claim?
The claim is about a population proportion (percentage) so the claim can be written $$ p \geq0.60$$
- What are the the null and alternative hypotheses?
Since the claim contains the condition of equality $(=, \ \leq \ \geq)$, the claim is the null hypothesis. (Recall that the claim can either be the null or alternative hypothesis, but the condition of equality always belongs to the null hypothesis.) \[ \eqalign{ H_0: \quad& p \geq0.60 \quad\text{(claim)}\cr H_a: \quad & p < 0.60 } \]
- What formula should be used for the standardized test statistic?
The test is about a population proportion, so the standardized test statistic is \[ z=\dfrac{\hat{p}-p_0}{\sqrt{\dfrac{p_0q_0}{n}}} \]
- What are the values of the test statistic and standardized test statistic?
The sample proportion is the test statistic. The sample proportion, $\hat{p}$, is 0.52 or 52% since $\hat{p}=\frac{x}{n}=\frac{208}{400}=0.52$. We can do a 1-prop-z-test on the calculator and get values for both the test statistic and the p value. We enter in the values of $p_0, \ \ x$ and $n$ as given in the statement of the problem, set the calculator to do a left-tailed test (select <$ p_0$) then press "calculate." Remember, $p_0$ is the hypothesized value of $p$ as stated in the null hypothesis. In addition, we know that we have a left-tailed test because the symbol used in $H_a$ is a < symbol.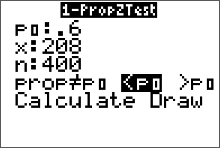 We get this output on our screen
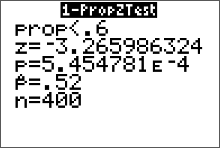 The standardized test statistic is the $z=-3.27$ (round it to two decimal places is the convention) standard deviations. The p-value is $5.454781E^{-4}$. The equivalent number in scientific notation is
\[
5.454781 \times 10^{-4},
\]
which is written in standard form as approximately 0.0005 (round to four decimal places since the p-value is a probability).
The standardized test statistic is the $z=-3.27$ (round it to two decimal places is the convention) standard deviations. The p-value is $5.454781E^{-4}$. The equivalent number in scientific notation is
\[
5.454781 \times 10^{-4},
\]
which is written in standard form as approximately 0.0005 (round to four decimal places since the p-value is a probability).
- Determine what the p-value is and use it to draw a conclusion about the test.
The p value is about $0.0005$. Recall that the significance level is $\alpha=1\%=0.01$. Since the \[ \color{red}{ p\text{-value} \leq \alpha, \text{ we reject }H_0} \] Note: the p-value $= P(\hat{p} < 0.52) = P(z < -3.26)\approx0.0005$. The p-value is the probability of getting a sample proportion at least as extreme (less than or equal) as the one we obtained, or $P(\hat{p} < 0.52)$, assuming the sampling distribution really is centered at $p=0.60$. The sign used in $H_a$ is a less than symbol, so we have a left-tailed test and the flow chart indicates the p value is the area left of the test statistic.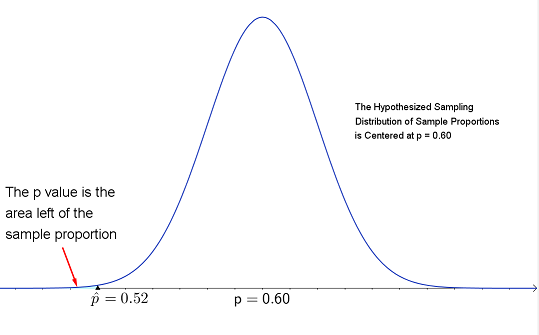
- State a full sentence conclusion using the statistical language learned in the class
We can use the flow chart to help us with the correct wording of the conclusion. There is sufficient evidence to warrant rejection of the claim that at least 60% of all orders are mailed within 48 hours.
Example (A two-tailed test for $p$)
In early April 2014, a major security flaw affecting perhaps 500,000 or more websites was announced and fixed. But the patch to the "secure socket" program that is supposed to encrypt and protect user information on secure websites was only made after more than two years of vulnerability on some of the most heavily trafficked sites, including Facebook, Google, YouTube, Yahoo and Wikipedia. Analysts warned that untold numbers of internet users might have had key personal information compromised either in their use of those websites, or their use of email, instant messaging, and even supposedly secure virtual personal networks.
The software bug was named "Heartbleed" and it was accidentally introduced to the OpenSSL encryption program on New Year’s Eve 2011. Some security commentators called Heartbleed "catastrophic" and said it was one of the worst vulnerabilities ever discovered on the web. Pew research center claims 39% of internet users have changed passwords or canceled accounts. This is taken from a random sample of 1501 internet users. A researcher decided to test that hypothesis at $\alpha=0.02$. She obtained a random sample of 250 internet users and found that 105 changed passwords or canceled accounts since the announcement of "Heartbleed." (Excerpts taken from Pew Research Center)
Use the p value method to test Pew Research's claim at the 2% level of significance based on the given sample data.
Questions/Instructions
- What is the symbolic form of the claim?
- What are the the null and alternative hypotheses?
- What formula should be used for the standardized test statistic?
- What are the values of the test statistic and standardized test statistic?
- Determine what the p-value is and use it to draw a conclusion about the test.
- State a full sentence conclusion using the statistical language learned in the class
Answers
- What is the symbolic form of the claim?
The claim is about a population proportion (percentage) so the claim can be written $ p =0.39$
- What are the the null and alternative hypotheses?
Since the claim contains the condition of equality $(=, \ \leq \ \geq)$, the claim is the null hypothesis. (Recall that the claim can either be the null or alternative hypothesis, but the condition of equality always belongs to the null hypothesis.) \[ \eqalign{ H_0: \quad& p =0.39 \quad\text{(claim)}\cr H_a: \quad & p \neq0.39 } \]
- What formula should be used for the standardized test statistic?
The test is about a population proportion, so the standardized test statistic is \[ z=\dfrac{\hat{p}-p_0}{\sqrt{\dfrac{p_0q_0}{n}}} \]
- What are the values of the test statistic and standardized test statistic?
The test statistic is the sample proportion. The sample proportion is 0.42 or 42% since $\hat{p}=\frac{x}{n}=\frac{105}{250}=0.42$. We can do a 1-prop-z-test on the calculator and get values for both the standardized test statistic and the p value. We enter in the values of $p_0, \ \ x$ and $n$ as given in the statement of the problem, set the calculator to do a two-tailed test (select $\neq p_0$) then press "calculate." Remember, $p_0$ is the hypothesized value of $p$ as stated in the null hypothesis. In addition, we know that we have a two-tailed test because the sign used in $H_a$ is a $\neq$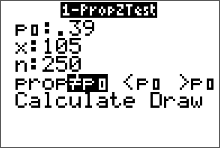 We get this output on our screen
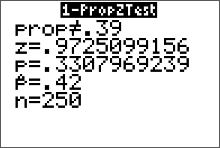 The test statistic is the $z=0.97$ (round it to two decimal places). The p-value is 0.3307.
- Determine what the p-value is and use it to draw a conclusion about the test.
The p value is about $0.3307$. Recall that the significance level is $\alpha=0.02$. Since the \[ \color{red}{ p\text{-value} > \alpha, \text{ we do not reject }H_0} \] Note: the p-value $=2\cdot P(\hat{p}>0.42) = 2\cdot P(z>0.97)\approx0.3307$. The p-value is the probability of getting a sample proportion at least as extreme as the one we obtained, or $2\cdot P(\hat{p}>0.42)$, assuming the sampling distribution really is centered at p=0.39. The sign used in $H_a$ is a not equals symbol, so we have a two-tailed test and the flow chart indicates the p value is twice the area right of $\hat{p}=0.42$. Since an equally unlikely value of $p$ might occur in the lower tail of the distribution, with equal probability, we must double the upper area to obtain the p-value.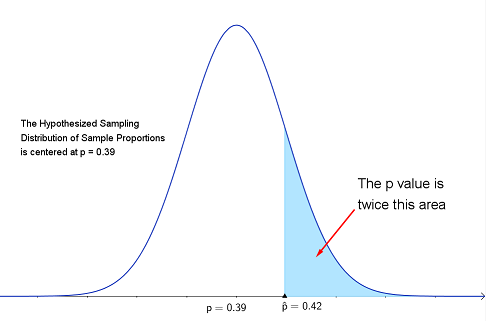
- State a full sentence conclusion using the statistical language learned in the class
We can use the flow chart to help us with the correct wording of the conclusion. There is not sufficient evidence to warrant rejection of the claim that 39% of all internet users have changed passwords or canceled accounts since the "heartbleed" virus was discovered.